Basic Usage:
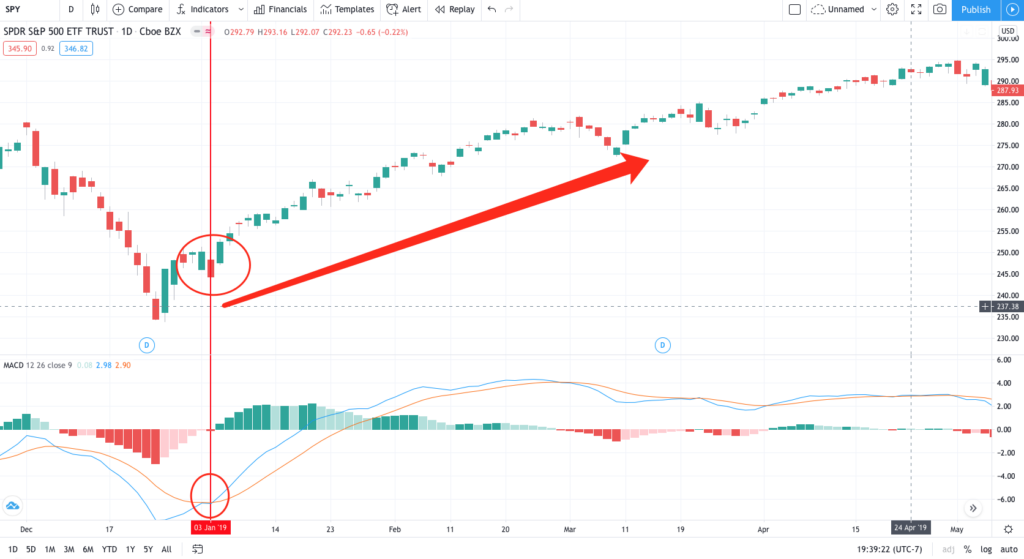
Buy in / Long (Gold Cross):
- When DIF and MACD are both above the 0-axis, and Fast_Length break from the bottom up through Slow_Length, it shows that this stock is in a strong position and about going up later.
- When DIF and MACD are below the 0-axis, and Fast_Length break from the bottom up through Slow_Length, it shows that this stock is about to become stronger, and the stock decline has been exhausted and will stop falling upwards. You can try to start buying or holding shares.
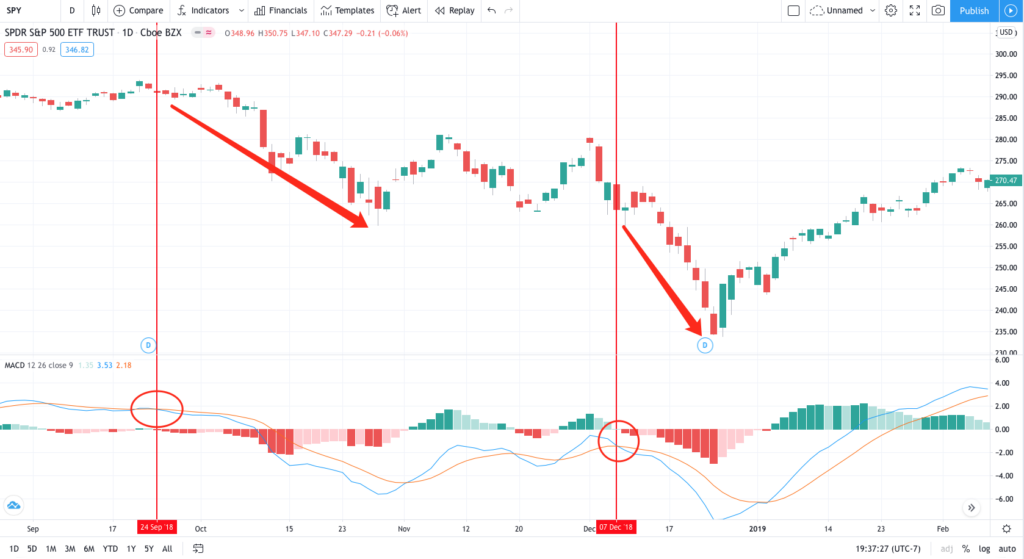
Sold out / Short (Dead Cross):
- When DIF and MACD are both above the 0-axis, and Fast_Length break from the top through Slow_Length, it shows that this stock is about to turn from a strong to weak, and the stock price will plummet.
- When DIF and MACD are both below the 0-axis, and Fast_Length break from the top through Slow_Length, it shows that this stock is getting into an extremely weak market again, and the stock price will fall.
Principle:
The MACD indicator is based on the principle of the construction of moving averages, smoothing the closing price of the stock price, and calculating the arithmetic average value. It is a trend indicator.
The MACD indicator uses fast (short-term) and slow (long-term) moving averages and the signs of convergence and separation, and double smoothing. The MACD developed based on the principle of the moving average, one removes the defect of frequent false signals from the moving average, and the other retains the effect of the moving average. Therefore, the MACD indicator has a moving average trend, stability, stability, etc. The feature is a technical analysis indicator used to study the timing of buying and selling stocks and predict the rise and fall of stock prices.
Mathematical concept:
In the application of MACD, first, calculate the fast moving average (ie EMA1) and slow-moving average (ie EMA2), and use these two values to measure the deviation between the two (fast and slow lines) ( DIF), and then find the N-period smoothed moving average DEA (also called MACD, DEM) line of DIF. Take the parameter of EMA1 as 12th, the parameter of EMA2 as 26th, and the parameter of DIF as 9th as an example to see the calculation process of MACD:
1. Calculate the moving average (EMA)
   The formula for the 12-day EMA is
   EMA (12) = EMA (12) of the previous day × 11/13 + today's
   closing price × 2/13
   The formula for the 26-day EMA is
   EMA (26) = EMA (26) of the previous day × 25/27 + today's
   closing price × 2/27
2. Calculate the deviation value (DIF) :
   DIF = Today's EMA (12)-Today's EMA (26)
3. Calculate the 9-day EMA of DIF:
   Calculate the 9-day EMA based on the deviation value, that is,
   the average deviation, which is the required MACD value. In
   order not to be confused with the original name of the
   indicator, this value is also known as DEA or DEM.
Special Analysis Method of MACD
- Price Action
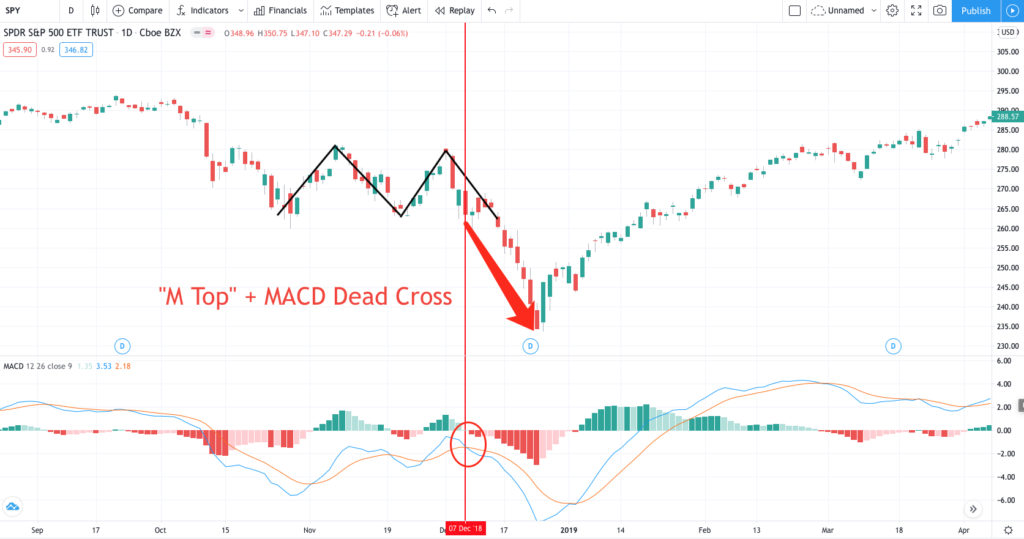
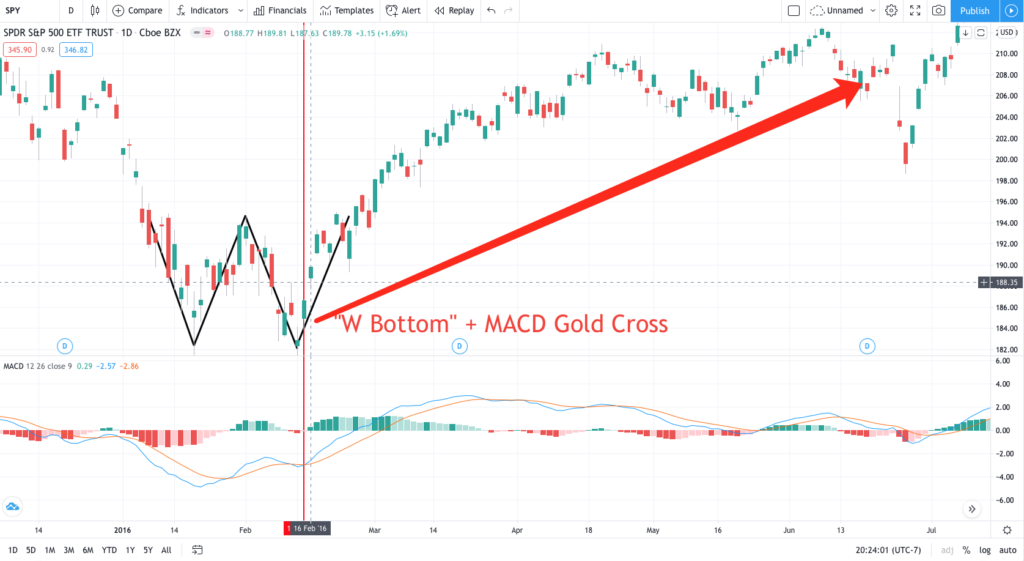
- “M Top”, “W Bottom” and other forms:
- The research and judgment of the MACD indicator can also help the research and judgment of the market from the shape of the MACD graph.
- When the red or green bars of MACD consist of double top and bottom (ie M head and W bottom), triple top and bottom, etc., it can also be analyzed and judged according to the research and judgment method of morphological theory.
- Divergence
- The divergence of the MACD indicator means that the trend of the MACD indicator’s graph is exactly the opposite of the trend of the K-line chart. The divergence of the MACD indicator has two types: top divergence and bottom divergence.
- Top divergence:
- When the stock trend on the stock price K-line chart is higher than the peak, the stock price has been rising, and the trend of the red bar on the MACD indicator graph is one peak than one peak, that is, when the stock price is higher than the previous one The high point is high and the high point of the MACD indicator is lower than the previous high point of the indicator, which is called the top divergence phenomenon. The phenomenon of top divergence is generally a signal that the stock price is about to reverse its trend at a high level, indicating that the stock price is about to fall in the short term, and is a signal to sell the stock.
- Bottom divergence:
- The bottom divergence generally occurs in the low area of the stock price. When the stock price moves on the K-line chart of the stock price, the stock price is still falling, and the trend of the graph composed of green bars on the MACD indicator graph is one bottom to one higher, that is, when the low point of the stock price is lower than the previous low point, The low point of the indicator is higher than the previous low point, which is called the bottom divergence phenomenon. The phenomenon of bottom divergence is generally a signal that the stock price may reverse upward at a low level, indicating that the stock price may rebound upward in the short term, and is a short-term buy signal.


