Technical indicators are processed for market data (volume, price, time, etc.) through some mathematical formulas, and then the results are connected to draw a continuous or discontinuous chart. People usually use these processed results to make decisions or predictions about market trends.
Each technical indicator will observe the stock price from a specific aspect, and obtain a deeper meaning through quantitative analysis. This will improve the success rate and accuracy of people’s transactions. And now there are more than 1,000 technical indicators on the market, most of which can be found on the software for viewing pictures. So if we are willing to classify them, there are two ways.
- From the functional classification, we have:
- Trend Indicators:
- Trend indicators refer to indicators that use trend analysis theory as the guiding ideology, combined with the characteristics of the moving average, and based on the relationship between stock prices and indicators, to analyze the strength of the stock price trend. The trend indicator is very important in the entire technical indicator system because it makes up for the fact that technical indicators cannot predict the size of each market to a certain extent. Commonly used are MACD, MA, EMA, SMA.
- Volatility Indicators
- The volatility indicator refers to a result obtained through a mathematical formula based on the stock’s trading volume, price, time, and space factors, and this result revolves around a certain spatial fluctuation and guides the actual operation through the law of fluctuation. Commonly used technical indicators are KDJ, RSI, WR.
- Momentum Indicators
- Momentum indicators are mainly used to examine the changes in stock prices from the perspective of the trading volume. Through the combination of trading volume and price, the results are calculated and used in actual operations. Commonly used technical indicators are VOL, VBP
- Trend Indicators:
- To classify from the purpose, we have:
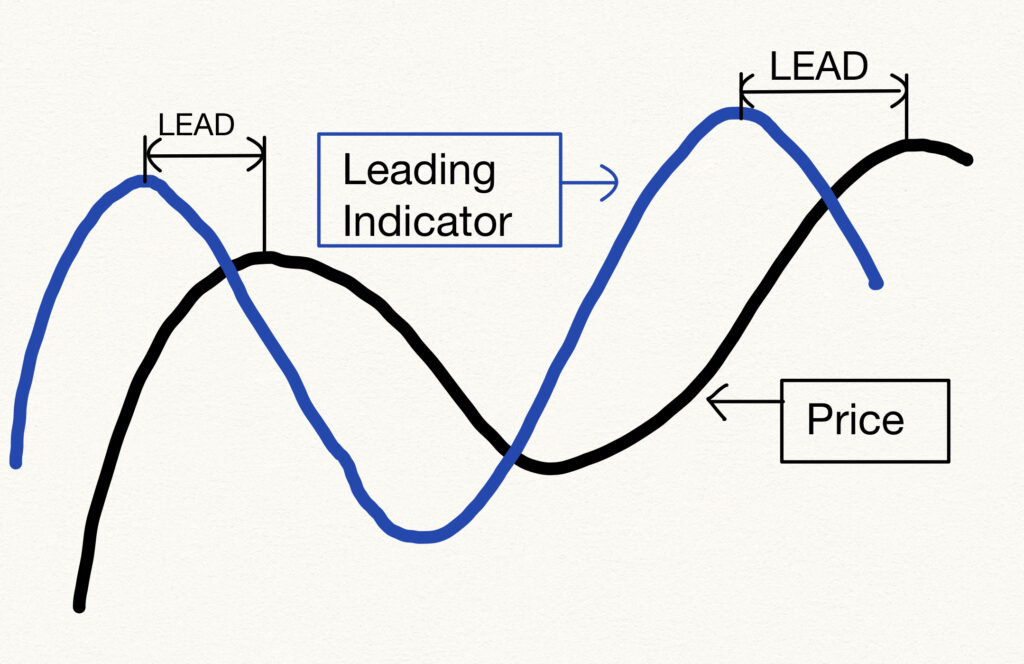
- leading indicators
- Leading indicators can predict future trends. Thus, these indicators can be used to predict a potential recession or recovery. For example, about stock market performance, retail sales, or building permits.
- As a result, leading indicators tend to outpace the economic cycle and are often appropriate for short – and medium-term cyclical analysis. Building permits, for example, are seen as a leading economic indicator. Its emergence could signal an increase in future demand for construction workers and investment in the housing market.
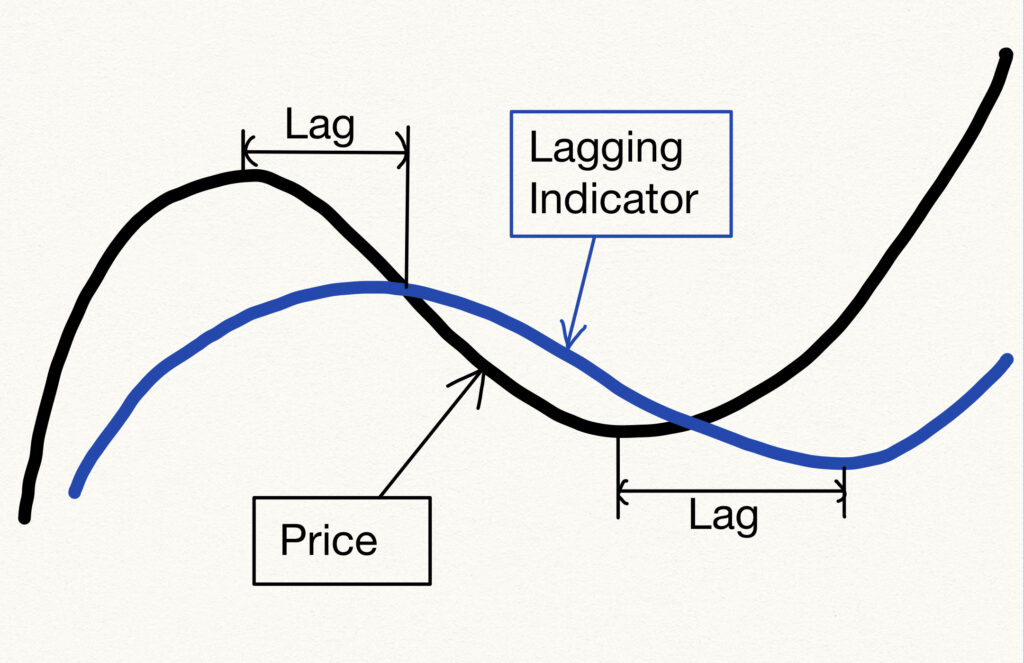
- lagging indicators.
- In contrast to leading indicators, lagging indicators are used to identify existing trends that may not be immediately apparent. As a result, this indicator lags behind the economic cycle.
- In general, lagging indicators are often applied to long-term analyses based on historical economic performance or prior price data. In other words, lagging indicators create signals based on market trends and financial transactions that have been initiated or established.
I need to clarify the fact that there is no perfect indicator in this world. If there is, everyone is the richest man in the world, but obviously, this is not the case. We should understand the usage and application scenarios of each indicator, and finally formulate our own trading strategy.
From now on, I will publish the basic usage and mathematical principles of technical indicators, and please just pay attention that I don’t think any of the indicators are the basis for trade because if it succeeds sometimes, there must be failures sometimes. The specific situation needs to be analyzed in detail, so please trade with caution.
Wish you success in the investment market !
“plan your trade, trade your plan”
–Lei

