In the past month, the new president (Joe Biden) of the United States finally settled in the White House smoothly and successfully, starting a new stage of political management work, and the social turmoil in the United States has gradually calmed down. During this period of time, many interesting things happened, such as the well-known GME short-squeeze event in the stock market. I did not participate in this event, but as a bystander, I can see something funny. My personal feeling about the incident is only one sentence, high-risk and high-income, not in an unfamiliar industry.
Then, let’s continue to read the basic data of the US economy.
- Weekly unemployment rate:
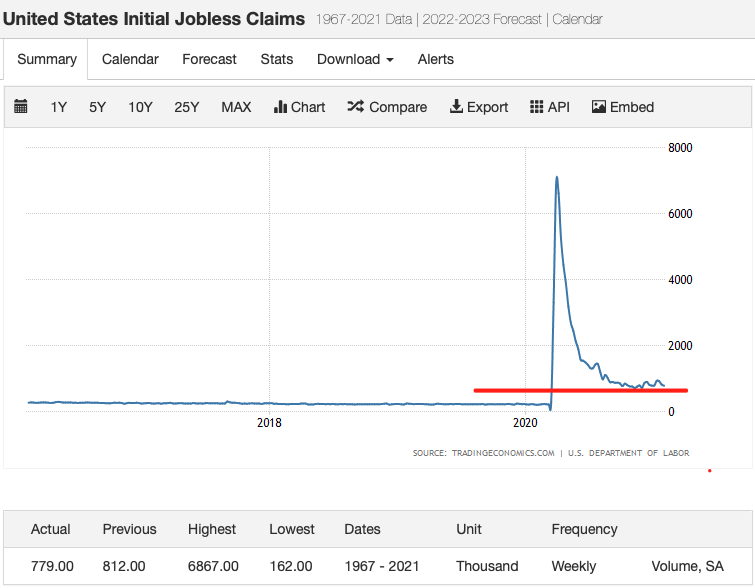
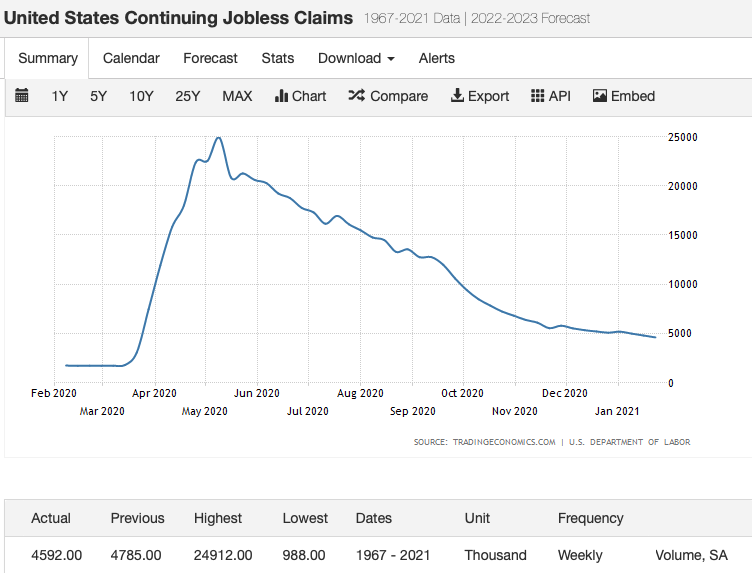
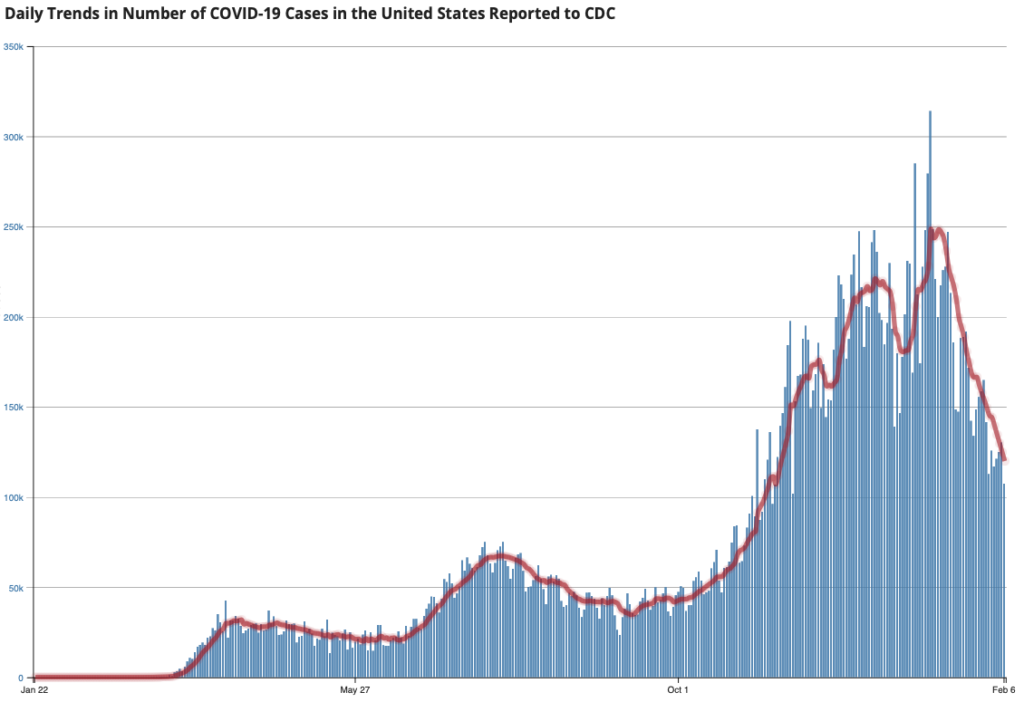
The data on initial and renewed claims for unemployment benefits in the United States has not fallen as expected in the past period of time, but stayed on a platform. Let us add a US Covid-19 data for comparison chart, we will find a more interesting thing. The number of new cases per day is gradually decreasing, and the mortality rate is also declining. Coupled with the opening of vaccines, the economic impact of the epidemic on the current price range has dropped significantly, and it also has a potential for future economic recovery. But if we look back at the unemployment data for the past month, we can find that these data do not seem to be more “reasonable” because of these “good news”.
But here we only analyze the public data. We respect market data and don’t make too many guesses. We can continue to observe whether the government’s subsequent bailout payments and the degree of people returning to their jobs will continue to improve.
- The New York Fed’s Economic Activity Index (WEI):
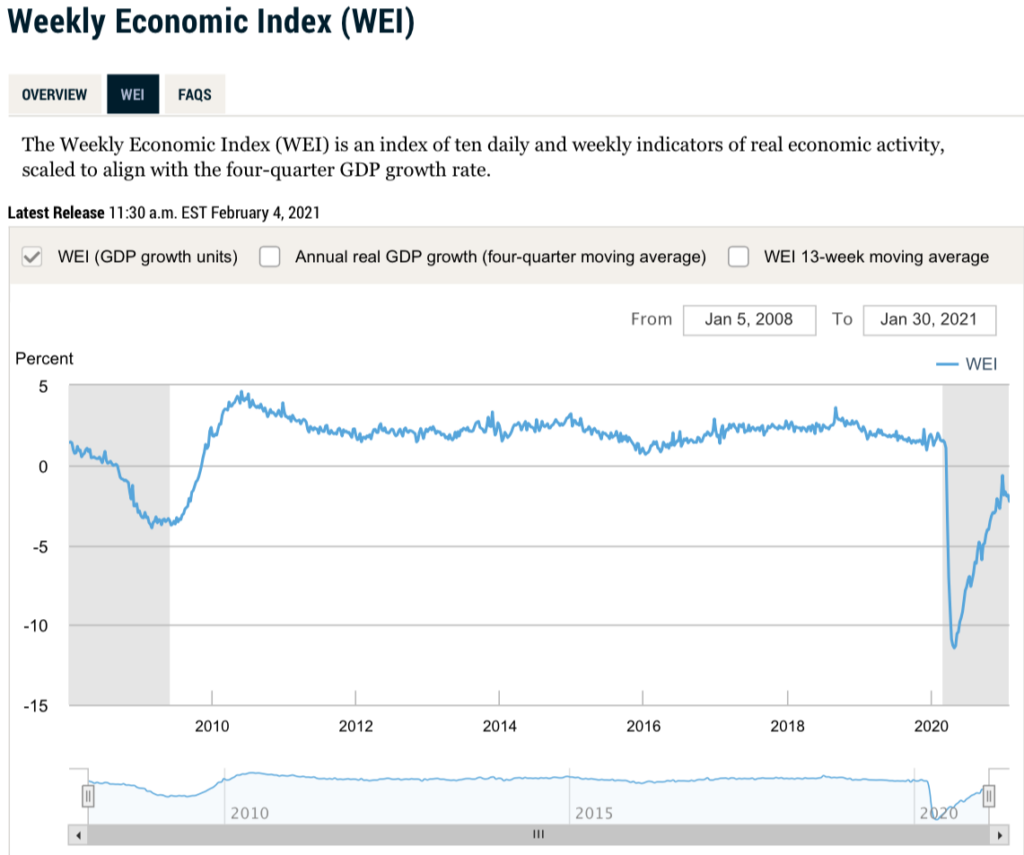
The WEI data also shows a certain degree of decline in the past period of time, and it is still in the negative range. It seems that the 0 axis will be a relatively difficult point to break through. But we don’t have to worry too much for the time being, because the vaccine has just been distributed to the public, and it is understandable that the economic activity index has not returned to the positive range before the scope of vaccination is expanded, because we have to comply with social distance and cannot meet on a large scale. the rule of.
If we look back at the data of the past year, you will find that the WEI data has been in the rising range after rebounding from the low level, and it appears very strong. We can continue to look forward to a more relaxed social control system. I believe that with the support of the vaccine, normal economic and social activities will return to the market.
- Copper Stock and Copper price
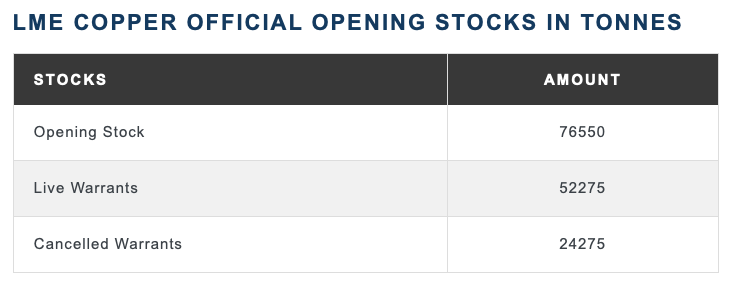
Copper is one of the important indicators of the fundamentals of economic activities, and the price of copper can directly reflect the real activity of economic activities. The futures market tends to send a signal before the fundamentals, because futures are closer to life than the stock market. Among them, copper futures dealers will keep an eye on the market. As long as copper stocks fall, copper prices will rise.
Copper inventories and copper prices are important data support for us to observe the activity level of the real economy. When copper prices fall, stock prices may fall along with it. Because the market may reflect from copper demand that the market is not as good as expected, then the market will make A corresponding feedback. This is why we include copper stocks and copper prices in our data observations.
In the past period of time, we can see that copper prices have reached a high level, but copper inventories have been declining. Based on the fundamentals of the social epidemic, we have reason to believe that social economic activities are preparing for greater increases.

- US crude oil inventory and production data
There has been a slight decline in US crude oil inventories, and production has remained on a platform, which has also led to an upward jump in crude oil prices. For the time being, crude oil indicators are still optimistic, let us continue to observe this data.

- Redbook Indicator
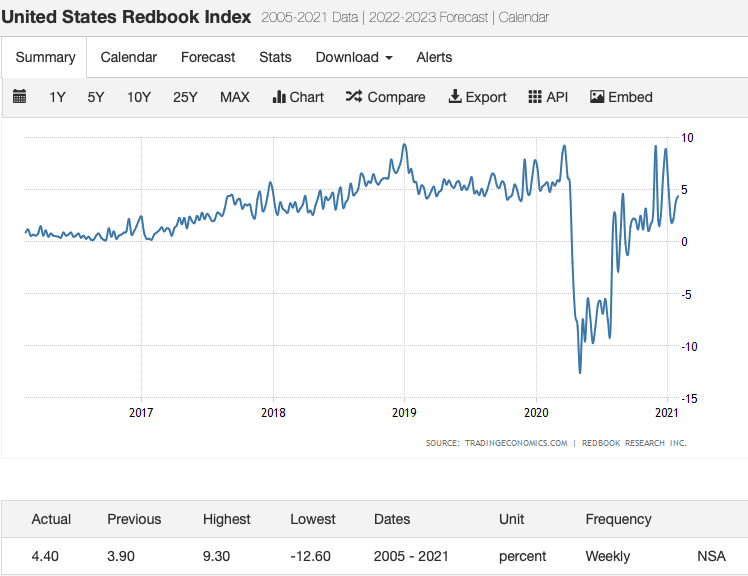
The Redbook indicator shows that it is still in the positive range and is also above the historical average. At the same time, the index of large discount stores is now at a high level, while the data of traditional department stores is still at a low level in the negative zone. Recently I will make a research report on American retail, and I will also post the research results on the website, hoping to share, communicate and learn with other friends.
- The Fed system open market holding
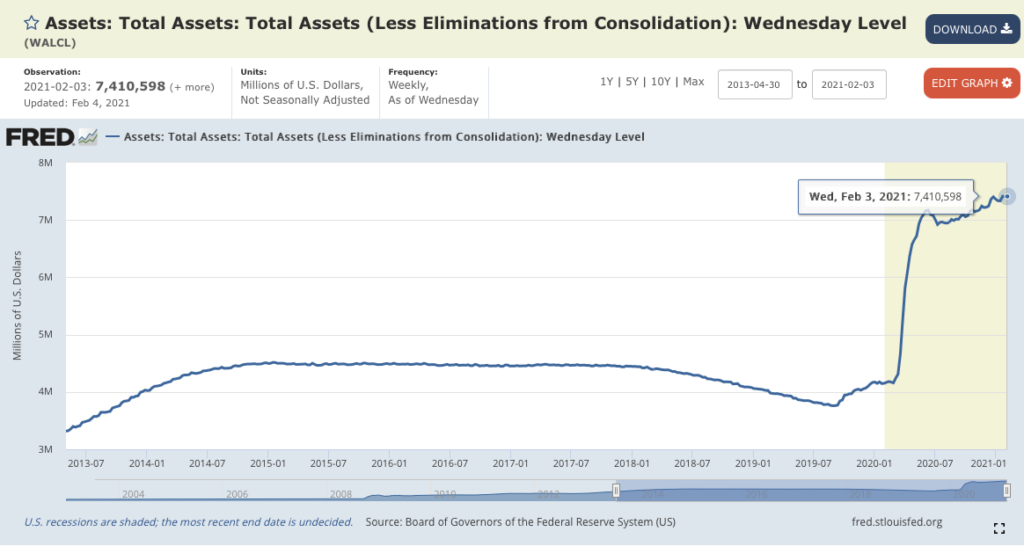
This time, the Fed’s public position data showed a very important data. The Fed’s T-note and T-bond holdings are decreasing. Although the decrease is not large, this is a phenomenon that deserves attention. We have always believed that the price of the capital market is mainly determined by buyers, and the Fed is now the largest buyer. When it decides to reduce the purchase of bonds, we should pay attention to this decision and observe whether there will be a major reaction in the market. turn. It may be a small adjustment, but I think we should pay attention to it.
