- Unemployment Data
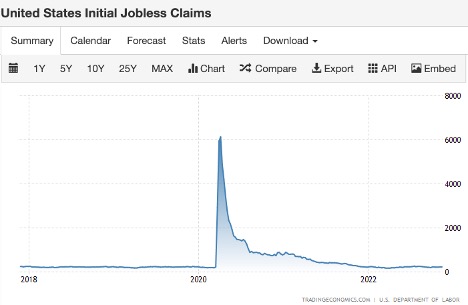
The number of Americans filing new claims for unemployment benefits fell by 4k to 222k on Nov 17th, which is lower than the expectation of 225k. It says the trend of a tight job market environment is still here. And we know that there is a large number of layoffs from high-tech companies, such as Apple, Twitter, Meta, etc. The cold season for the job market will last for a period. As the picture is shown below, we noticed that even though the unemployment claim was trying to go back to the normal level, there is still a way from here. Combined with the Federal Reserve’s recent efforts to rein in inflation, the pressure on businesses to survive in an environment of high-interest rates is even more acute.
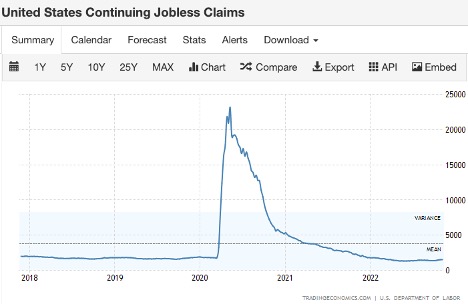
The number of Americans filling continuing claims for unemployment benefits rose to 1.5 million on Nov 17th, which is slightly higher than the expectation. Compared to initial jobless claims, the continuing jobless claim has been back to normal level already. However, it is the largest amount of continued unemployment benefits recorded since March 2022, extending the disconnect between mixed levels of initial unemployment benefits and longer-term job seekers. According to the notes of Trading Economics, this result indicated that the unemployed Americans have been out of work for long periods already, which is in line with the slowdown of the economy brought by aggressive interest rate hikes by the Federal Reserve.
- The Weekly Economic Index (WEI)
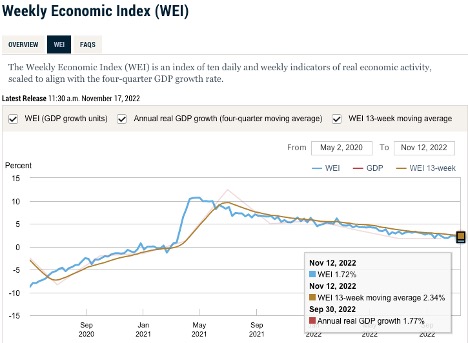
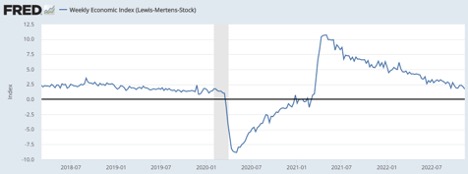
The latest number of WEI is 1.72%, a positive result that means the economy is still in expansion. However, we can see the trend if keep going down since March 2021. It means the speed of expansion keeps declining, which is in line with the slowdown of the economy brought by aggressive interest rate hikes by the Federal Reserve. We need to pay more attention to how the market and community act in such a situation. There is a couple of large holiday events at the end of the year, even though it is a cold season now, hopefully, it can enlarge or increase the power of the purchase behavior and drive more sales in the market.
- Copper inventories of the three major exchanges (London Futures Exchange, Shanghai Futures Exchange, and New York Mercantile Exchange):
The copper price, which is $3.68 now, is still in a related low position. The down trending started in April 2022. We care about the copper price because copper is one of the most important indicators that can reflect the fundamental of economic activity, and the copper price can directly reflect the degree of activity of the economy.

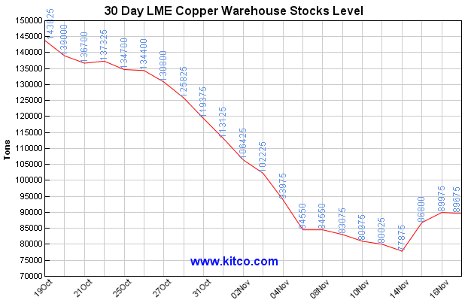
Let’s check the LME Copper Warehouse Stocks Level now. As we can see that the stock level kept declining in the past 30 days, but slightly increased MTD. We noticed that the price and the stock level are at the related low level now, which shows that the degree of market activity is not high. In general, the copper future is likely to show trouble sooner than the market fundamentals. Copper inventory and copper prices are important data support for us to observe the activity level of the real economy. When the copper price falls, the stock market may fall along with it, because the market may reflect from copper demand that the market is not as good as expected, and then the market will respond accordingly. Copper prices remain relatively low, which is conducive to the PPI decline. We need to pay more attention to this part.
- Data on Crude Oil Inventories and Production in the United States
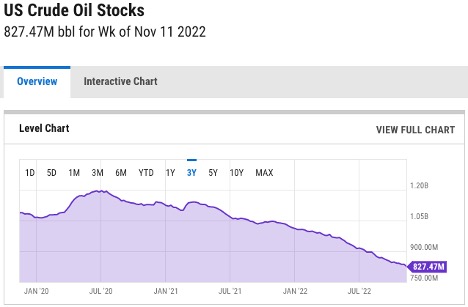
As we can see that the U.S. crude oil stock level keeps declining since July 2020. The latest number for crude oil stock is 827.47M on Nov 11, 2022, down from 836.97M last week (-1.14% WoW) and down from 1B (-20.78%) from last year. The weekly stocks of US oil reflect the US crude oil supply and demand dynamics. In periods of low prices or low oil demand, US oil suppliers can be observed to stockpile oil inventories.

- Fed System Open Market Holdings
(Asset price level is determined by buyers) Stock prices are generally determined by buyers, and demand determines the price. When there is a disaster, the number of buyers will drop dramatically, which is a liquidity crisis. The Federal Reserve stepped in as the world’s biggest buyer (unlimited QE), thereby keeping financial markets stable. Over time, as the buyers gradually return, the Fed will slowly pull back and let the market run its course.
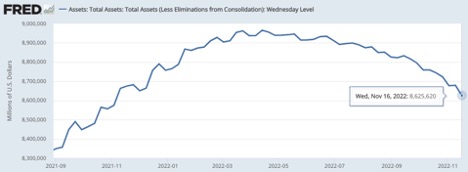
Based on the graph below, we can see that Federal Reserve started to reduce their holding starting on Apr 13, 2022. The associated SPY price dropped about 11%. It makes sense because the market should not be affected by Covid-19 anymore, and business activity should be back to normal. The healthy way is to let the market run by itself accordingly.
- Conclusion
- Market Supply and Demand Situation:
- The Federal Reserve’s open market positions are decreasing and the inflect rate is one of the most concerned indexes for the whole market, as a rational individual investor, we should realize the existing risk. We might need to prepare for missing the “invisible hand” soon and determine whether the market can be operated by itself.