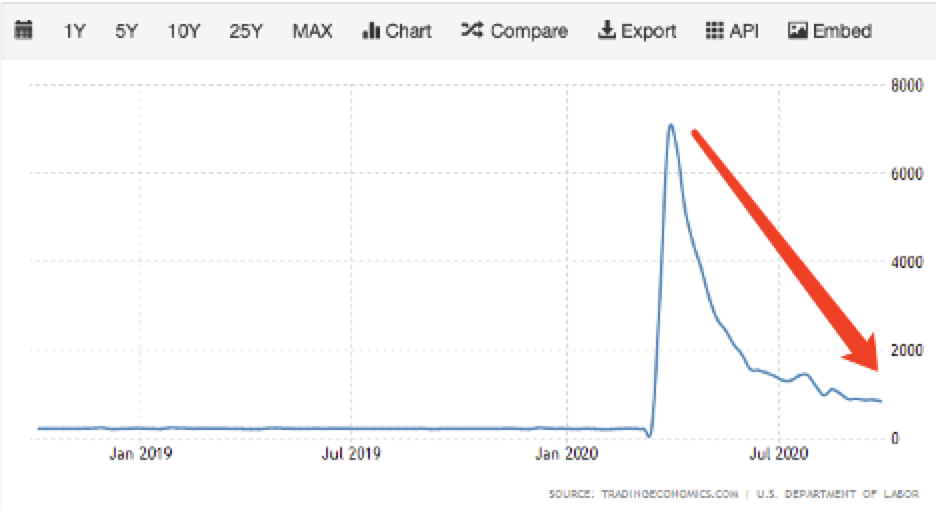
- Unemployment Rate:
According to the data of the most recent week, the number of initial claims for unemployment benefits was 83.7k; the number of continuous claims for unemployment benefits was 11767. This is stock data. Observed by historical data, the downward trend of these two sets of data is very obvious.

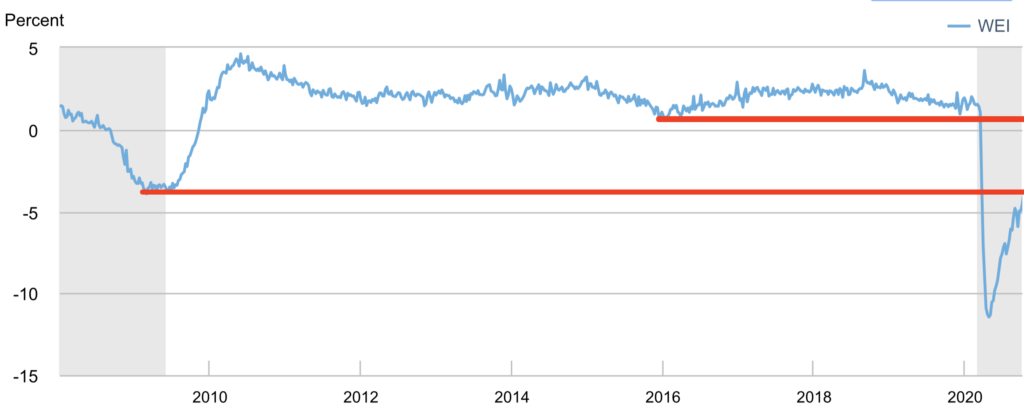
- The New York Fed’s Economic Activity Index (WEI)
This index continues to rise this week and is still gradually recovering, but it is still some distance from the bottom of 2008 and a long distance from the normal average level. It is still in the negative zone and is slowly reducing losses.

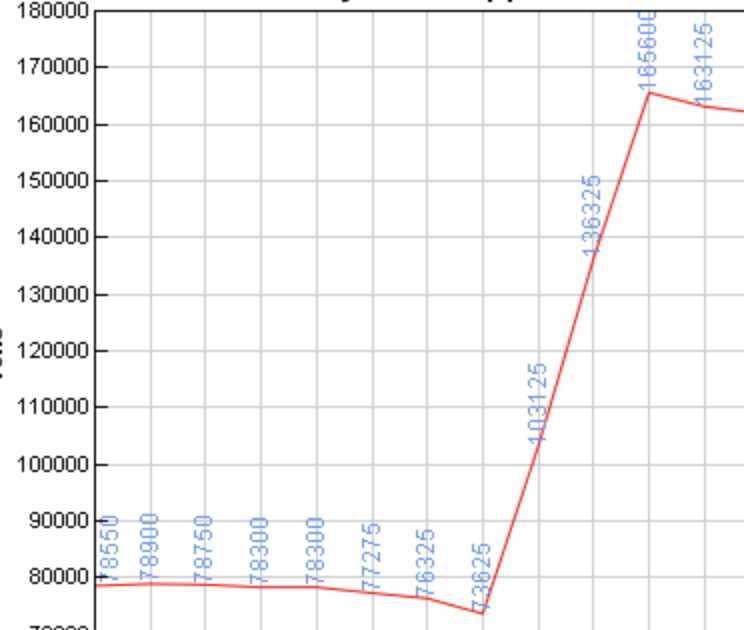
- Copper inventories of the three major exchanges
The latest data shows that there has been a jump in growth, leading to a relatively large drop in copper prices. Does this data Can be in a stable state, this still needs to continue to observe. Since the end of March, the price of copper has risen by about 30%, which has a certain correlation with the copper inventory. The continued decline in copper inventories will have a supporting effect on copper prices. Copper inventory and copper prices are important data support for us to observe the activity level of the real economy. When copper prices fall, the stock market may fall along with it. Because the market may reflect from copper demand that the market is not as good as expected, then the market will make corresponding feedback.

- Data on crude oil inventories and production in the U.S.
Crude oil inventories continue to decline, and production fluctuates in a range. Oil prices fluctuate in a relatively narrow range during the recent period. The trend is not obvious. It seems to be waiting for news and needs to be observed.

According to the CL1 chart, we can see that the current oil price is very interesting. Since Jun 23 has covered the gap, there has been a lack of upward force. The current retracement has reached the 120 MA, but the 120 MA is still up. Forecast: Crude oil will have a short-term rebound action, possibly with a false breakthrough. I am trying to closely observe the crude oil contract for next June
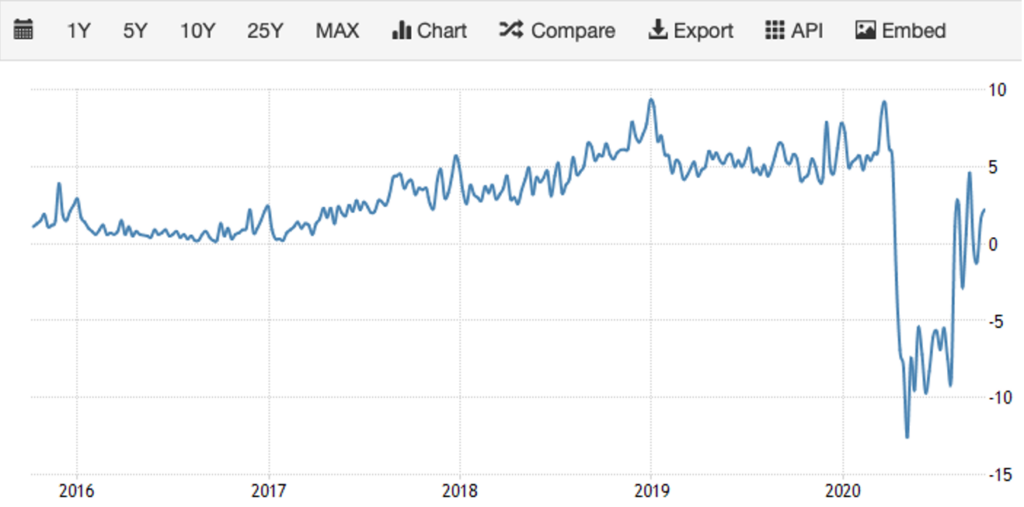
- Redbook Index (Retail store sales index)
- Johnson Redbook vibrates near the zero axes without much fluctuation
- Large shopping malls have a good reversal trend, which would be a good sign because consumption is very important to the US economy

- Fed System Open Market Holdings
- Positions dropped slightly
- U.S. Treasury holdings are still at a new high
- The holding of ANBS (Real Estate Mortgage Securities) decreased slightly

Conclusion
- Market Supply and Demand Situation
The Federal Reserve’s open market positions are still increasing, so there is no need to worry about the financial market crash. The level of asset prices in the financial market is determined by buyers, and the world’s largest buyer (the Federal Reserve) will not have much price correction.
- Economic Fundamentals
- Oil-to-Gold ratio: downward, showing that the market’s expectations for inflation are falling
- Copper-to-Gold ratio: down, showing that economic activity is down
- The market hopes that the economy will stabilize, and economic stabilization requires these two ratios to rise, which will cause the Federal Reserve to tighten the currency, which is not conducive to the capital market.
These two ratios have a falsifying effect on the market. For example, in the early days, many people believed that the Fed’s rescue of the market could hold the economy and make the economy better and better. But now the decline of these two ratios has just falsified this market expectation. This market expectation may be reversed.
- Risk Indicator
- Japanese Yen/USD and Japanese Yen: Going up in the same direction means that market risk appetite has increased and people are willing to take greater risks. At the same time, the ratio of junk debt to investment grade (HYG/LOD) is used to confirm this direction. Financial common sense: fixed income products of financial products. The higher the interest rate, the higher the risk.
- Banking and real estate (Bank/SPX and Real Estate/SPX): They are still hovering low, indicating that people are still on the sidelines of these two sectors.
- High dividends and high-yield bonds (High Div/SPX and High Yield/SPX): They are still hovering at a low level, indicating that people do not care about high-yield products and people may be more willing to invest in high-risk products.
- Summary: The market sentiment is relatively optimistic, not afraid of risks.
This is the right website for anybody who wants to find out about this topic. You understand a whole lot its almost tough to argue with you (not that I personally would want toÖHaHa). You definitely put a new spin on a topic which has been written about for years. Excellent stuff, just excellent!