- Unemployment Rate:
The number of initial claims for unemployment benefits was 898,000 (incremental data), and the number of continued claims for unemployment benefits was 1.018 million (stock data). The overall trend is still going downward.
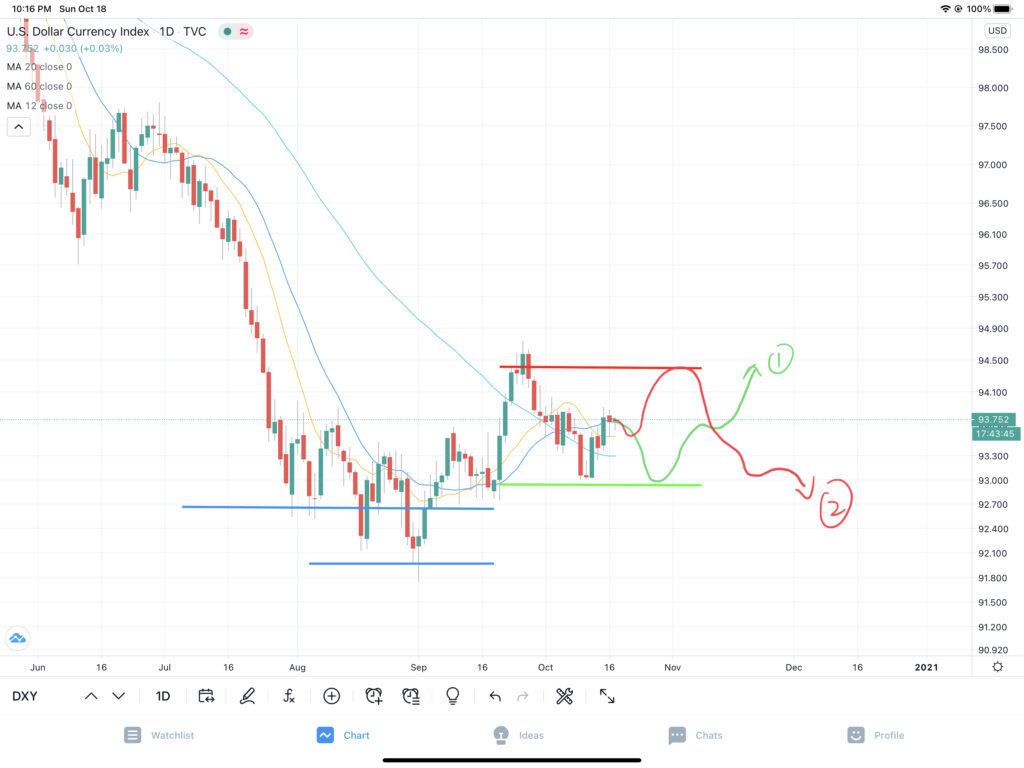
- The New York Fed’s Economic Activity Index (WEI)
The data is still rising strongly and has now returned to near the low point in 2008, and the economy is gradually recovering. Although it is still in the negative zone, it can be clearly seen that economic activities have picked up significantly.
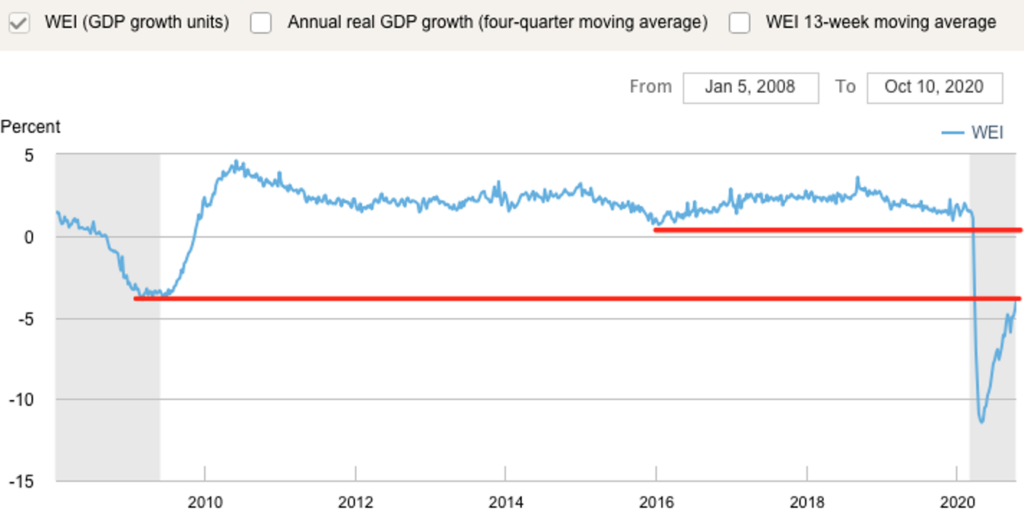
- Copper inventories of the three major exchanges
There has been an increase in copper inventories for three consecutive weeks. This is not a good phenomenon in the short term, which will have a suppressing effect on copper prices. We assume that copper prices cannot be maintained here for a long period of time, and there will be an opportunity for copper prices to fall. We will wait and see.
- Data on crude oil inventories and production in the U.S.
Crude oil inventories continued to decline this week, and crude oil production continued to fluctuate in a narrow range.

We need to focus on the trend of oil prices. It is now in a “density range of moving averages.” Combined with the crude oil futures positions in December 2020, there is a high probability that there will be a bearish and bullish final direction here. Given that the delivery time of crude oil futures is in November, that is to say, we still have about one month to observe this trend. If you decide to go up, then there will be a strong bullish trend. If you go down, then the market will enter a more difficult situation, let us wait and see.
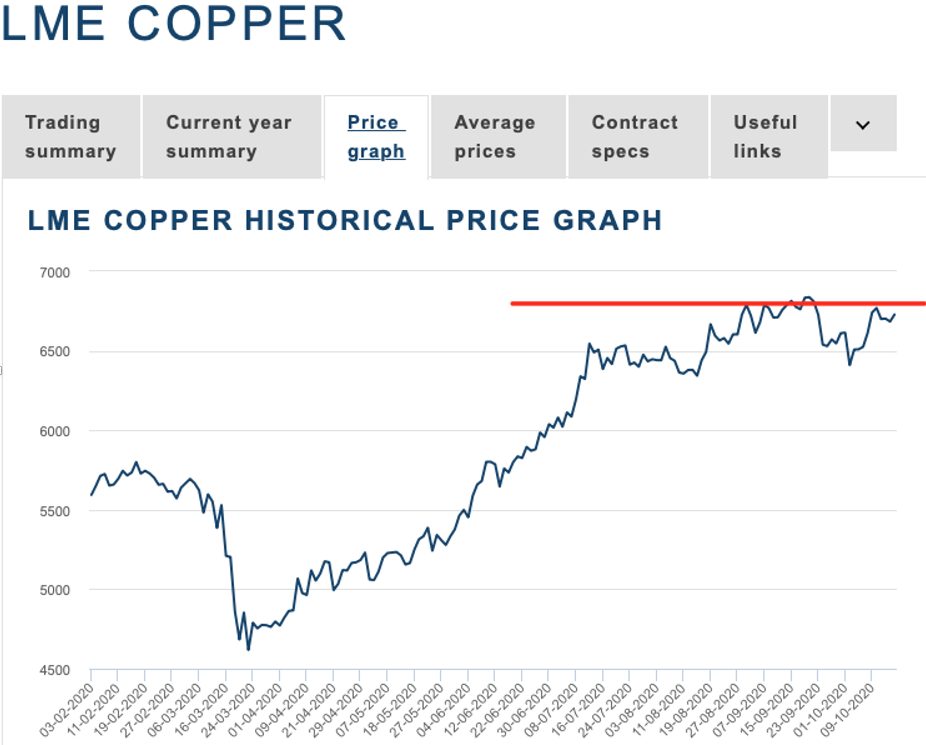
- Redbook Index (Retail store sales index)
Consumption is very important to the U.S. economy. The number of Redbooks this week has dropped in a short-term, but it is still in the positive range, and in the autumn and winter, the sales volume of goods will be relatively reduced. There is no need for excessive panic for the time being, just continue to observe market data.
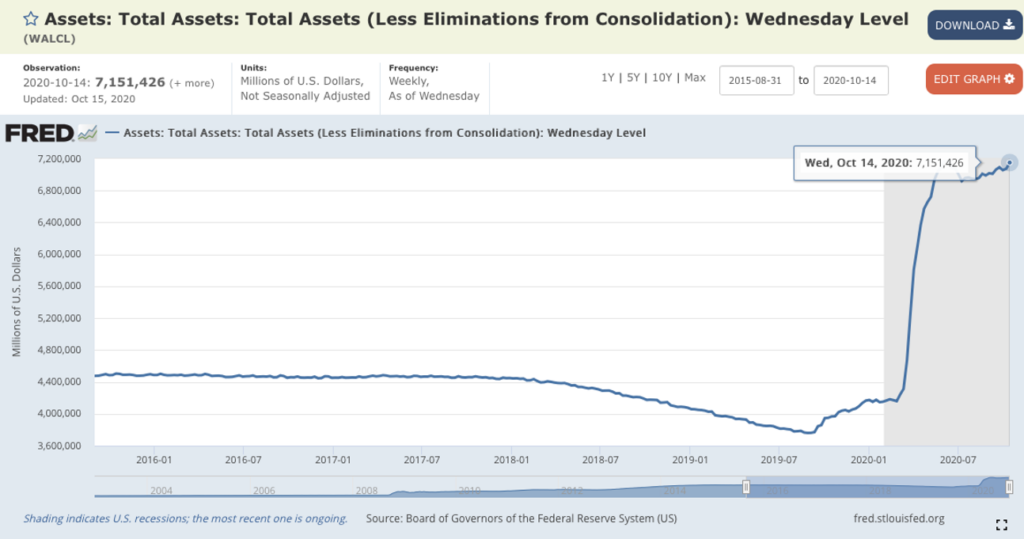
- Fed System Open Market Holdings
Data from the Fed shows that the number of positions held has reached a new high, which means that the Fed is still buying bonds. This week’s record high data include (Total Holding, T-note & Bond, Agency MBS, TIPS)
Conclusion:
- The Federal Reserve’s open position is still at a new high, so there is no need to worry in the short term.
- The fundamentals of the US economy:
a. Focus on the Fed’s target interest rate. Here we can focus on the U.S. 10-year Treasury bond yield. If this data breaks upwards, it means that the U.S. is about to tighten its monetary policy. This will be a disaster for the stock market (under the current environment)
b. Oil-to-money ratio: upward = upward inflation expectations
c. Copper-gold ratio: Upward = Upward economic activity - Risk indicators:
a. YEN/USD and GOLD: going down in the same direction indicates that investors are more willing to bear high-risk projects.
b. Banking and real estate sectors: continue to decline, still not optimistic. Banks are the engine of the real economy, and in the environment of low-interest rates, the outlook for the banking industry is not particularly clear.
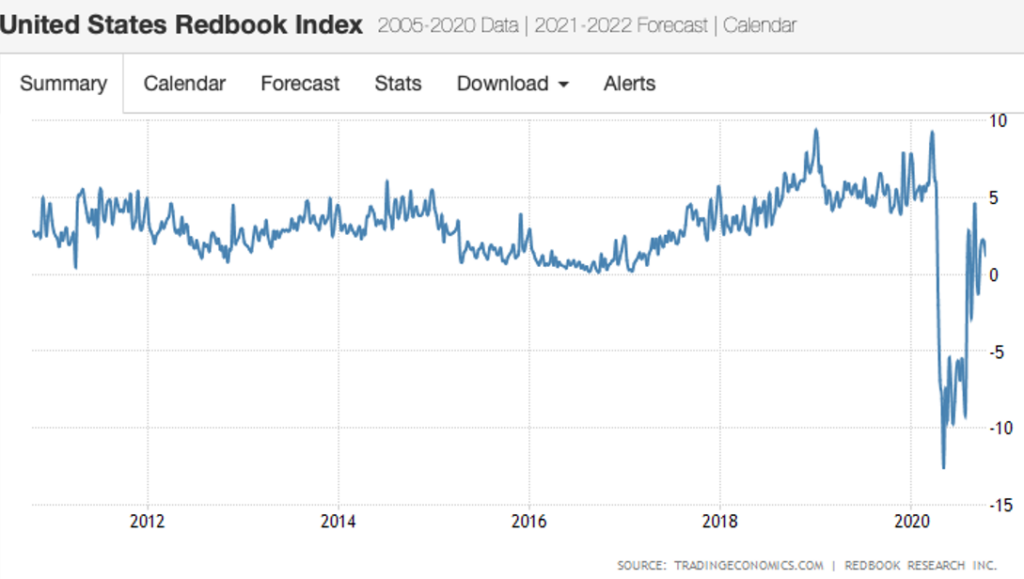
c. USD Index and 10-year Treasury Bond Yield: The U.S. dollar weakens in the short-term, and the 10-year Treasury yield has not yet risen. In the short term, these two data are in a horizontal development trend, and there is no need to decide the upward or downward direction. In the context of the two indexes not moving upwards, combined with the Federal Reserve’s public position data, the stock market is still mainly bullish in the short to medium term. The following is the deduction of the dollar index:- Case 1 is a bullish trend.
- Case 2 is a short trend. Assuming a break below [91,92], there will be a relatively strong bearish trend.
