For this channel, I am going to share some high-frequency data which is released weekly and try to do some market pre-play.
For market data analysis, I will focus on the following fields, and also attach the LINKs, feel free to search these data:
- The initial application for unemployment benefits and continuous application for unemployment benefits in the United States: Unemployment (Jobless)
- For normal socio-economic development, this data needs to return to the mean period.
- https://tradingeconomics.com/united-states/jobless-claims (initial unemployment claims).
- https://tradingeconomics.com/united-states/continuing-jobless-claims (continuing unemployment claims)
- New York Fed’s Economic Activity Indicator (WEI): Weekly Economic Indicator.
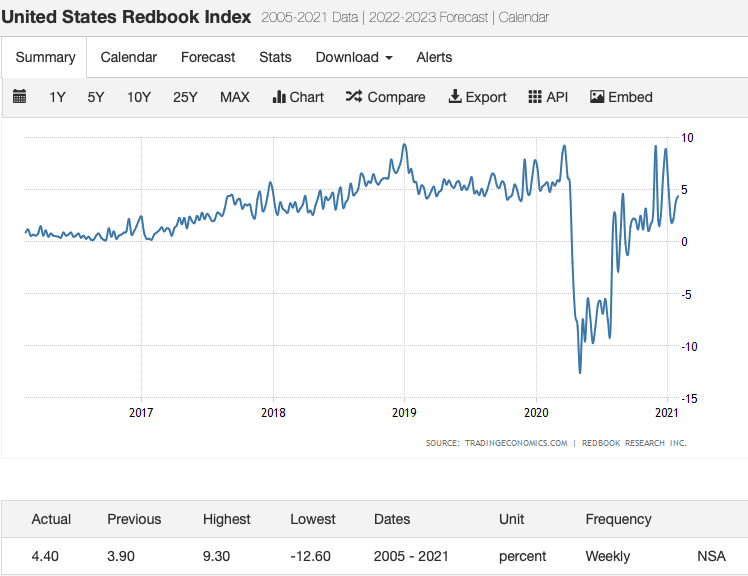
- Red Book: Redbook Same-Store Sales Index
- Reflect on the situation in the US retail industry.
- Johnson Redbook Index Same-Store Sales Weekly YOY%.
- Department Stores YOY% Department Stores.
- Discount Stores YOY%.
- https://tradingeconomics.com/united-states/redbook-index
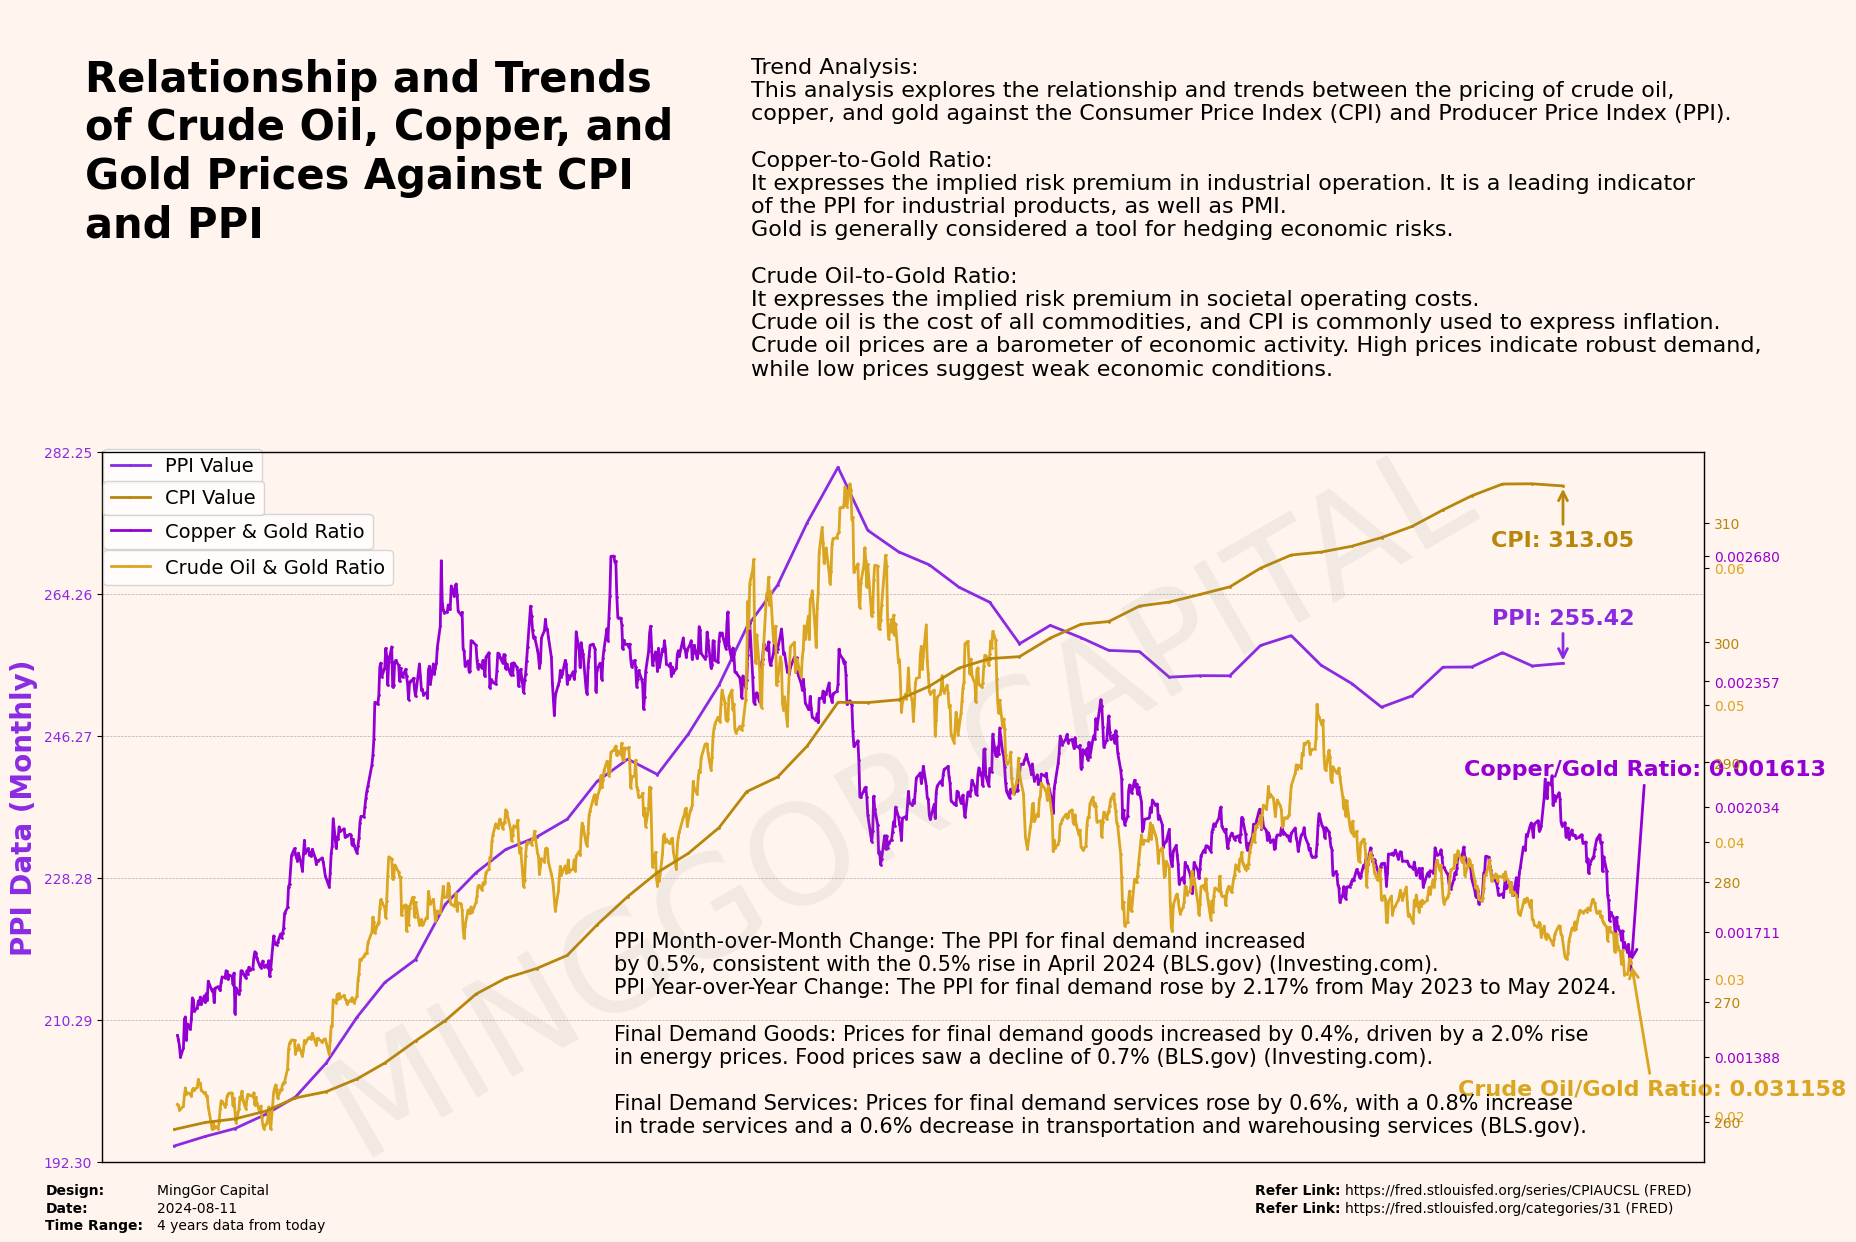
- Copper Stockpiles (LME on the London Futures Exchange, SHFE on the Shanghai Futures Exchange, COMEX on the New York Metal Exchange): Copper Stockpiles.
- Copper is an important indicator of the fundamentals of economic activities, and the price of copper directly reflects the degree of activity in economic activities.
- Futures take action before the fundamentals because futures are close to reality, and copper futures spot merchants run globally. As long as there is a drop in copper inventory, copper prices will rise immediately.
- Copper inventories and copper prices are important data support for us to observe the activity level of the real economy. When copper prices fall, the stock market may fall along with it, because the market may reflect from copper demand that the market is not as good as expected, so the market will Make corresponding feedback.
- Copper inventory of the three major exchanges + copper price
- https://www.lme.com/en-GB/Metals/Non-ferrous/Copper#tabIndex=0 (LME)
- http://www.copperenews.com/copper-warehouse-stocks.asp (LEM + CME)
- http://www.shfe.com.cn/statements/dataview.html?paramid=weeklystock (SHFE)
- [US copper price? WILL UPDATE LATER]
- Crude oil inventory and production
- Fed open market positions
- (Asset price level is determined by the buyer) The stock price is generally determined by the buyer and the demand. When a disaster occurs, the number of buyers will drop sharply, which is called a liquidity crisis. The Fed enters the market as the world’s largest buyer (unlimited QE), thereby maintaining the stability of the financial market. Over time, when buyers gradually return, the Fed will slowly withdraw its “invisible hand” and let the market go on its own way.
- https://fred.stlouisfed.org/series/WALCL
- https://www.newyorkfed.org/markets/soma/sysopen_accholdings (Total SOMA Holdings) (Notes/Bonds) (Agency Mortgage-Backed Securities)
Nov 17, 2022
The number of Americans filing new claims for unemployment benefits fell by 4k to 222k on Nov 17th, which is lower than the expectation of 225k. It says the trend…
Apr 13, 2021
Weekly Unemployment Rate: The number of Initial Jobless Claims and Continuous Jobless Claims has fluctuated in a small range for a period of time. As we discussed last time, although…
March 7, 2021
Weekly unemployment rate: From the charts below, we can find that the number of initial jobless claims has remained at the relative high lever compare to the history, but compare…
Feb 7, 2021
In the past month, the new president (Joe Biden) of the United States finally settled in the White House smoothly and successfully, starting a new stage of political management work,…
Dec 27 2020
Weekly unemployment rate: In the past two weeks, due to the recurrence of the epidemic, many areas have implemented the stay-at-home order again, which has caused a small amount of…


